Title: Eastern Idaho Stream Gaging
Location: Madison, Bingham, Jefferson Counties, Idaho
Client(s): Idaho Department of Water Resources
Partner(s):
Eastern Idaho Stream Gaging
Introduction
Idaho Water Engineering (IWE) monitors and maintains eight stream gage stations in eastern Idaho under contract with the Idaho Department of Water Resources (IDWR). Three of the stations are located on irrigation return drains and one is downstream from a fish hatchery. In addition to recording water levels, the stream gaging services include measurement of instantaneous stream discharge, development and maintenance of stage discharge rating curves, and posting the data on a web site. The contract divides monitoring of the stations into two groups, year round, and March 15th to October 31st (See Station Table). Four of the stations are telemetered using cell data modems. The sites are visited at approximately six-week intervals during the monitoring periods to take discharge measurements and collect logged gage levels for the non-telemetered sites. The collected data are used to develop and maintain stage-discharge rating curves.
Discharge Measurements
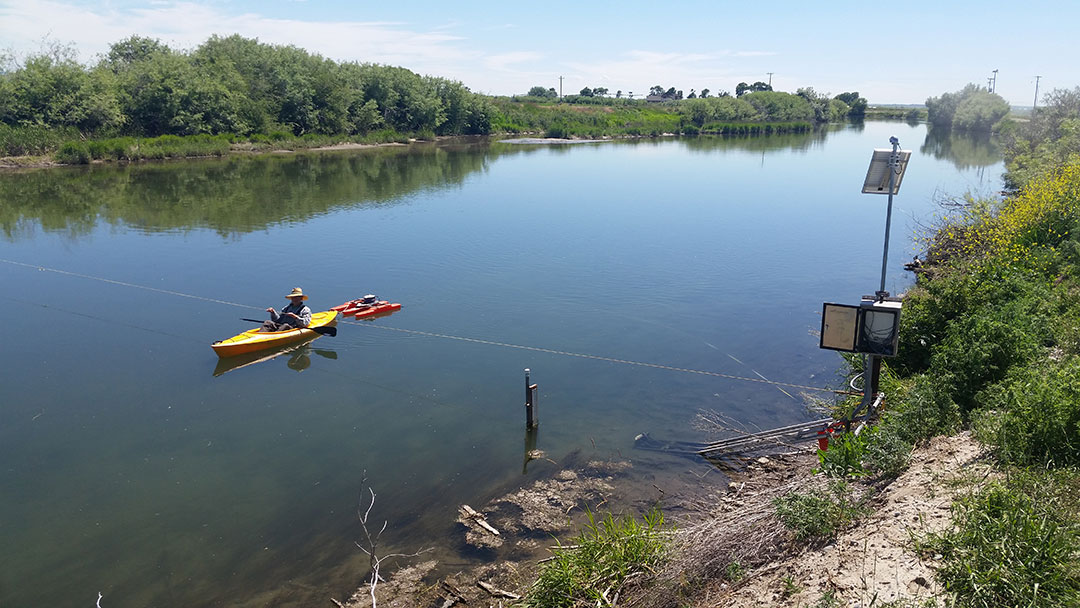
Discharge is the volume of water flowing past a point per unit time, often expressed in units of cubic feet per second (“CFS”). Discharge is measured in the wadable streams using a FlowTracker ADV (acoustic Doppler velocimeter) with a top-setting wading rod. The hydrologist measures water depth and velocity by wading along a cross section and uses the data to calculate the streamflow in CFS at a particular water surface elevation as indicated on a permanent staff gage. A StreamPro ADCP (acoustic Doppler current profiler) is used to measure discharge in the non-wadable streams. The instrument is mounted on a small catamaran and the ADCP measures water depth and the profile of current velocity as the boat is towed slowly across the channel.
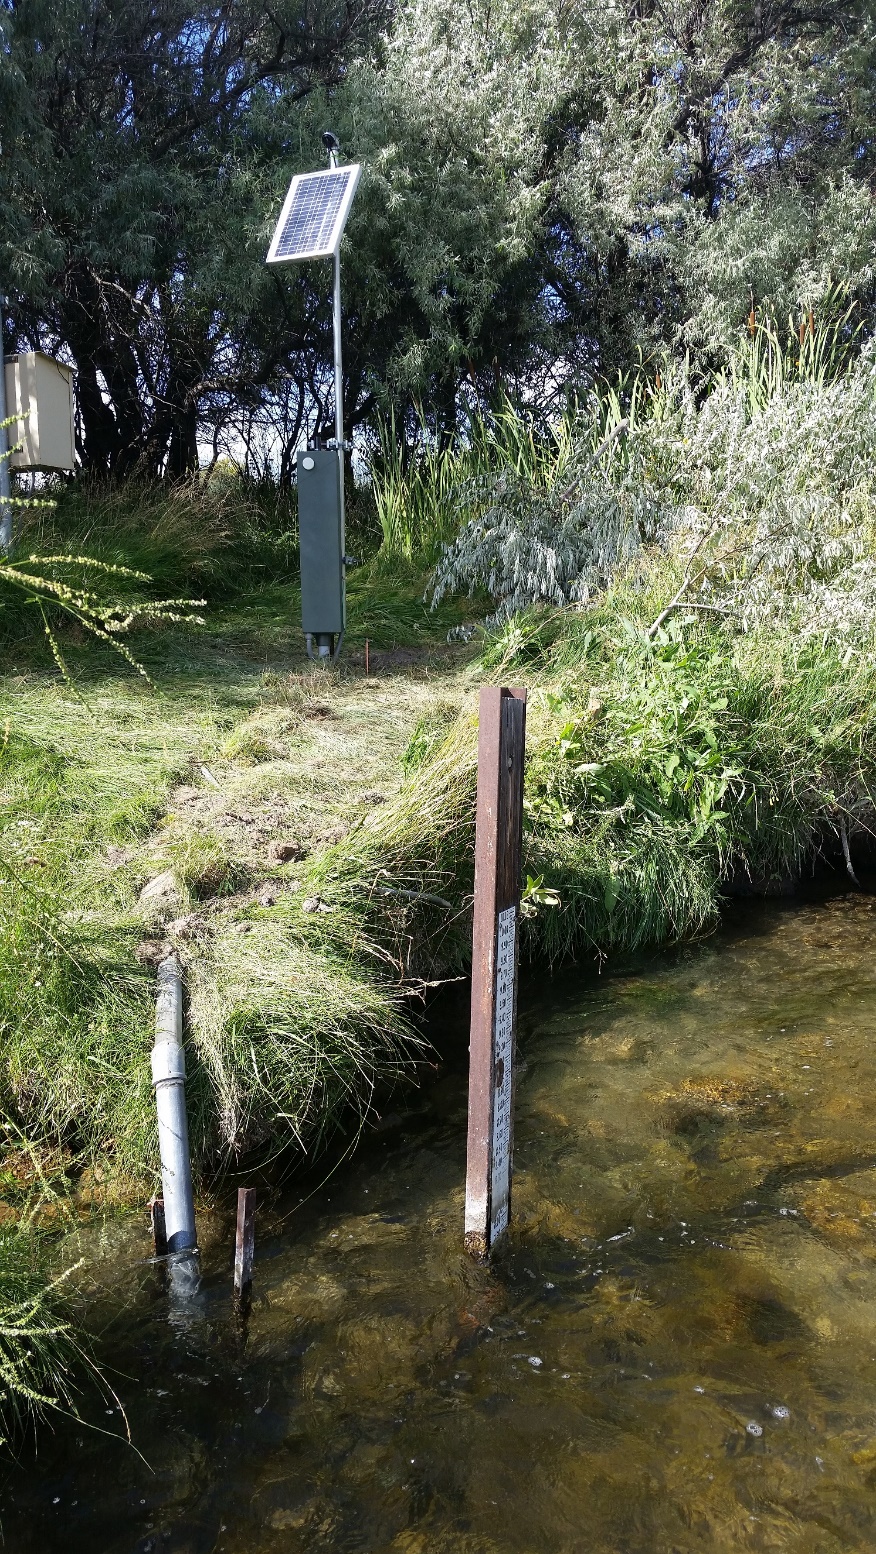
Water Level, Data Logging, and Telemetry
Water level is measured with an electronic pressure transducer that is vented to the atmospheric to compensate for changes in barometric pressure. The transducer also measures water temperature, and is housed in a galvanized steel pipe that is anchored to the stream bed. The submersed transducer communicates with a data logger located on shore that records temperature and pressure data once every fifteen minutes. The data are stored in the logger’s memory and are either retrieved during a periodic visit to the site or through telemetry. Data from the telemetered stations are retrieved daily and posted to a data portal on the internet. At the Dry Bed gaging station, flow conditions are complicated because the station is in a back-water area of the Snake River during part of the year. A sidelooking ADV (SonTek SL) is installed at this station and provides continuous measurements of velocity across the channel. The velocity data provide a more accurate measurement of discharge than could be achieved using water depth alone.
Station Table
| Station Number | Symbol | Station Name/Description | Latitude | Longitude | County | Measurement Schedule |
|---|---|---|---|---|---|---|
| 13056550 | tscn | Texas Slough Canal near Thornton | 43.799782 | -111.913535 | Madison | A |
| 13056600 | txsl | Texas Slough near Rexburg | 43.788153 | -111.895983 | Madison | A |
| 13056900 | scsl | Scott Slough near Menan | 43.74245 | -111.972045 | Jefferson | A |
| 13057020 | drdb | Dry Bed near Lewisville | 43.70369 | -112.070394 | Jefferson | A |
| 13057030 | spcn | South Parks Canal near Lewisville | 43.68653 | -112.063089 | Jefferson | A |
| 13069536 | dncr | Danielson Creek near Springfield | 43.093466 | -112.682418 | Bingham | B |
| 13069525 | bncr | Boone Creek near Springfield | 43.060295 | -112.657227 | Bingham | B |
| 13069528 | htcr | Hatchery Creek near Springfield | 43.04787 | -112.681178 | Bingham | B |
| mtcr | McTucker Creek near Springfield | Bingham | C |
| Index | Description |
|---|---|
| A | Every 6 weeks during irrigation season (Apr. 1 - Nov. 1) and once during the non-irrigation season (Nov. 2 - Mar. 31) |
| B | Every 6 weeks throughout the year |
| C | Every 6 weeks--only if the site is not inundated with Snake River water |
| Telemetry Sites |
Rating Tables
Water height (or stage) is converted to volume of water using a rating curve, that can be expressed as a rating table. The rating curve depends on the hydraulic characteristics of the stream channel, and can vary over time due to factors including:
- Growth of aquatic vegetation
- Shifting of sand-bed stream bottoms
- Changes in the flood plain during high flow
- Growth of riparian vegetation
The rating curve is developed based on periodic direct discharge measurements at stream gaging stations. Once established, the rating curve is used to calculate discharge from logged water level measurements to provide a streamflow record for each data point, which is typically 15-minute intervals.
The current version of the rating tables for the EIDSG stations are available by selecting one of the following links:
| Station | Revision Date | File Name |
|---|---|---|
| Boone Creek | 18-Feb-2021 | BooneCreek_SpecifiedRatingTable_18Feb21.pdf |
| Danielson Creek | 18-Feb-2021 | DanielsonCreek_SpecifiedRatingTable_18Feb21.pdf |
| Dry Bed | 13-Feb-2021 | Dry Bed Base Rading Table.pdf |
| Hatchery Creek | 18-Feb-2021 | HatcheryCreek_SpecifiedRatingTable_18Feb21.pdf |
| Scott Slough | 4-Jan-2021 | Scott's_Slough_Base_Rating_Table_7-1.pdf |
| South Parks Canal | 5-Feb-2021 | South Parks Canal Base Rating Table 6-1 |
| Texas Slough | 24-Jan-2021 | Texas Slough Base Rating Table 4-1 |
| Texas Slough Canal | 9-Feb-2021 | Texas_Slough_Canal_Base_Rating_Table_8-1 |
Data Analysis
IWE uses the Next Generation Aquarius Time-Series (“AQTS”) software developed by Aquatic Informatics to process hydrologic data. AQTS is the same software used by USGS, Water Survey Canada, and many states, including Idaho. Using this software, which supports a SQL relational database, IWE imports the discharge measurements and 15-minute interval level-temperature data retrieved from dataloggers. From the discharge measurements and level data, AQTS produces rating curves and interpolates the level data to generate 15-minute interval discharge and daily average flows. Data are graded for quality considering the impact of seasonal changes in channel morphology and conditions that compromise flow measurement accuracy. The AQTS platform provides a consistent data analysis approach and maintains an audit record of calculations and adjustments to the data.
Data Portal
Data are posted on the internet using the Vista Data Vision (VDV) platform, which provides for historical plotting of time series, access to notes, and data retrieval. Click on image below to open VDV in a separate window: